
Module 2 · Chapter 5
Greenhouse gas emissions from fertilizer use
A significant portion of greenhouse gases that cause global warming are released into the atmosphere as a result of agricultural activities. The amount of greenhouse gas emissions due to agricultural activities and land use on a global scale has reached 9.3 Gt CO2 equivalent as of 2018 [1]. While the amount of emissions based on plant and animal production was 5.3 Gt CO2 equivalent in 2018, this amount increased by approximately 14% when compared to 2000.
Greenhouse gas emissions originating from agriculture mostly consist of methane (CH4) and nitrous oxide (N2O) gas. The highest greenhouse gas emission among agricultural activities is enteric It occurs as a result of fermentation and its ratio in all agricultural activities is close to 48%. One of the most important agricultural inputs in plant production is fertilizers, and due to fertilizers, there is a significant greenhouse gas emission to the atmosphere. 10% of the gases emitted to the atmosphere due to agricultural activities were realized through synthetic fertilizers in 2020 [2]. Apart from chemical fertilizers used in agriculture, animal manures also have an important share as an emission source. In Table 1, the amount of greenhouse gas emissions originating from agriculture worldwide in 2020 is given.
Table 1. Distribution of Agricultural Greenhouse Gas Emissions in 2020 on a Global Scale
| Emission Source | Amount of Emission (Kiloton of CO2 equivalent) |
% |
|---|---|---|
| Enteric fermentation | 2849716 | 47.60 |
| Animal manure left in the pastures | 772541 | 12.91 |
| Rice cultivation | 686111 | 11.46 |
| Synthetic fertilizers | 625107 | 10.44 |
| Animal manure use and management | 399815 | 6.68 |
| Burning of savannas | 211921 | 3,54 |
| Agricultural product residues | 191540 | 3.20 |
| Animal manure applied to the soil | 165093 | 2.76 |
| Cultivated organic soils | 46996 | 0.79 |
| Burnt agricultural product residues | 37387 | 0.62 |
| TOTAL | 5986227 | 100 |
There is a general increase in greenhouse gas emissions to the atmosphere over the past years. This situation is also valid for greenhouse gas emissions originating from agricultural production, and emission rates have increased over the years depending on the activities carried out. However, the increase in emissions from agriculture due to the use of chemical fertilizers has reached much higher rates. Table 2 shows the greenhouse gas emissions of some agricultural activities over the years. In the 60-year period, the rate of increase, which was around 40-50% according to the activity, was realized at a rate approaching 10 times in the same period for synthetic fertilizers. In addition, as it can be understood from the Table 2, a significant amount of greenhouse gas emissions occur during the production of these fertilizers, apart from the use of fertilizers.
Table 2. Changes in Agricultural Greenhouse Gas Emissions over the Years
| Emission Source | Emission amount (Kiloton of CO2 equivalent) | Rate of Change (%)* | ||||||
|---|---|---|---|---|---|---|---|---|
| 1961 | 1970 | 1980 | 1990 | 2000 | 2010 | 2020 | ||
| Enteric Fermentation | 1829661 | 2069925 | 2320767 | 2493671 | 2473802 | 2654500 | 2849716 | 56 |
| Rice Cultivation | 487941 | 560752 | 609831 | 620854 | 653281 | 682752 | 686111 | 41 |
| Fertilizer Applied to Soil | 109013 | 122615 | 144580 | 156499 | 145270 | 156386 | 165093 | 51 |
| Synthetic Fertilizers | 63209 | 174069 | 334374 | 425288 | 446178 | 559822 | 625107 | 889 |
| Fertilizer Production | 152687 | 225708 | 361709 | 389142 | 155 | |||
*Change rates are based on the amounts realized in 2020 compared to 1961 (as there is no data for 1961 in fertilizer production values, 1990 is based on)
Mechanism of Greenhouse Gas Release to the Atmosphere by Fertilizers
Agricultural greenhouse gas emissions mainly consist of nitrous oxide (N2O) from fertilization and methane (CH4) gas from cattle breeding. As shown in Figure 1, although N2O and CH4 gases are less common in the atmosphere compared to CO2 gas, they have higher global warming potentials. In the Global Climate Change Panel, it has been stated that the unit masses of CH4 and N2O gases have a global warming potential of 25 and 298 times more respectively, compared to CO2 gas for a period of 100 years [3]. It is predicted that the emission of greenhouse gases originating from agriculture to the atmosphere has increased significantly in recent years and if no measures are taken, the amount of N2O in the atmosphere will increase by 35-60% and the amount of CH4 by 60% by 2030 [4].
Figure 1. Global greenhouse gas emission rates (adapted from Ritchie et al., 2020 [5]).
Nitrous oxide molecules can stay in the atmosphere for an average of 114 years [3]. Globally, the majority of N2O emissions enter the atmosphere naturally, but about 40% are caused by human activities [6]. Human-induced N2O emissions are largely released into the atmosphere by agricultural activities (Figure 2). Nitrogen fertilizer use in agricultural activities has a great effect on N2O emission.
Figure 2. N2O emission sources in 2020 [7]
The two main ways N2O is produced in agricultural soils are nitrification and denitrification. The conversion of ammonium to nitrate ions by some microorganisms in the soil is defined as nitrification. Nitrification takes place in the presence of oxygen. Denitrification is the reduction of nitrate to free nitrogen gas (N2) after various processes. In this process, although the conversion of nitrate to N2 gas is usually complete, a small and variable amount of nitrogen is released into the atmosphere in the form of N2O gas [8]. Nitrification and denitrification events are tried to be summarized in Figure 3.
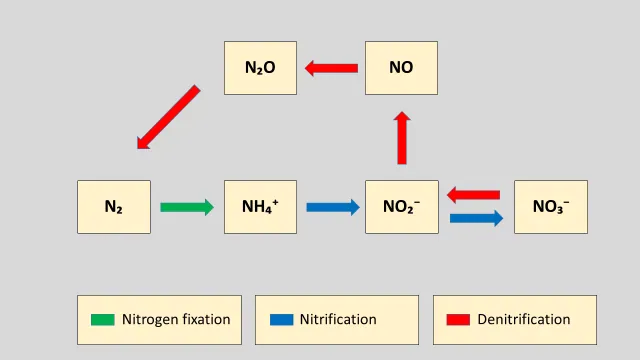
Nitrogen gas emission from the soil to the atmosphere can occur directly in the form of N2O emission and have a radiative effect, as well as through nitrogen emissions such as NO2 and NO (together called NOx) and other greenhouse gases such as ozone (O3) and methane (CH4). It has an indirect effect by affecting the atmospheric concentrations of the gases [10]. Ozone gas, which is a strong oxidant, can cause some problems in plant growth. In plants exposed to ozone gas for a long time, carbohydrate production decreases [11], and sensitivity to diseases and pests increases [7].
Unlike other nitrogen fertilizers, when urea fertilizer is applied to the soil, the CO2 added in the industrial production process is released. Urea (CH4N2O) turns into ammonium (NH4+), hydroxyl (OH-) and bicarbonate (HCO3-) ions in the presence of water and urease enzymes. The HCO3- formed as a result of the reaction is separated into CO2 and H2O, which form itself after lime is added [12]. In this way, the CO2 release from the soil is at lower levels compared to the N2O release from nitrogen fertilizer applications [8].
Greenhouse Gas Emissions from Synthetic Nitrogen Fertilizers
Fertilization is the first method used to increase productivity in crop production. Nitrogen, the nutrient element that limits plant growth the most, is an indispensable element of continuity and productivity in plant production. Nitrogen fertilizers are among the most used fertilizers globally. Annual nitrogen fertilizer production is estimated to be around 100 Tg N on a global scale [13].
However, nitrogen fertilizers can cause some serious environmental problems if they are not used carefully. Nitrate pollution in groundwater is one of these problems. Another important problem is the emission of nitrogenous fertilizers into the atmosphere by turning into N2O gas, which plays an active role in global warming, as a result of denitrification after the application. A very small portion (0.5-3.0%) of the nitrogen applied to agricultural fields is actually released into the atmosphere as N2O [14, 15], but its effect is very strong due to its high global warming potential and its ability to stay in the atmosphere for a long time. When evaluated in terms of global warming potential, each 1 kg of N input applied to the soil corresponds to 1.4-14.0 kg of CO2 and is accepted as an average of 4.65 kg of CO2 [12].
N2O released into the atmosphere due to the use of nitrogen fertilizers is the largest human source of N2O [16]. Greenhouse gas emissions have increased approximately 10 times due to the use of synthetic fertilizers since 1961 (that is the start of when we can access data on a global scale related to this). Greenhouse gas emissions from synthetic fertilizers account for about 11% of total emissions from agriculture [2]. A significant amount of these emissions come from the Asian continent (Figure 4).
Figure 4. N2O emission ratios from synthetic fertilizers in 2001-2011 by continents [17].
China is the largest producer and consumer of nitrogen fertilizers in the world. About 7% of all greenhouse gas emissions in China come from the production and use of nitrogen fertilizers [18]. Greenhouse gas emissions from the use of synthetic nitrogen fertilizers account for approximately 55% of agricultural emissions in China, and synthetic nitrogen fertilizer applications are considered to be the most important factor contributing to N2O emissions from agricultural soils [19]. For this purpose, researchers tried to determine the amount of greenhouse gas emissions caused by the production and application of synthetic nitrogen fertilizers for wheat and corn, which are important agricultural products of China, with a modeling method. Accordingly, annual synthetic nitrogen fertilizer consumption for wheat and corn is reported as 12.63 Mt. The greenhouse gas emissions associated with the production of synthetic nitrogen fertilizers across the country are given as 41.44 Mt CO2 equivalents for wheat and 59.71 Mt for corn. As a result of the application of nitrogen fertilizers, N2O release into the atmosphere was estimated as 35.82 and 69.44 Gg N2O year-1 for wheat and corn, respectively.
One of the most important problems encountered worldwide in the management of synthetic nitrogen fertilizers is the application time of the fertilizer. The main thing in fertilization is to prepare nitrogen in the soil when the plant needs it. Otherwise, nitrogen in excess of the plant need will be lost in the form of N2O emission or washed down in to soil. Adjusting this, is a complicated issue especially in plants such as corn, where the nitrogen requirement is very low in the first period of vegetation, but this need increases greatly in the later stages [10]. Giving nitrogen fertilizers during periods when plants are not planted yet or when their requirements for vegetation are very low can lead to loss of a large amount of nitrogen.
Some Environmental Factors Affecting Greenhouse Gas Release from Fertilizers
Nitrous oxide in soils is affected by various environmental factors. The amount of N2O formed depends on the amount of oxygen in the soil voids, and the reaction direction depends on the temperature. In low temperature conditions, the conversion of nitrogen compounds slows down, while the rate of conversion increases with increasing temperature. As the water saturation ratio increases in soils, O2 concentration decreases. Another factor affecting N2O release from agricultural soils is the amount of ammonium (NH4+) that can be used for nitrification and the concentration of nitrite (NO2-) to be used in denitrification. In addition, in light textured, neutral or slightly acidic soils, N2O release increases with the presence of NO3 nitrogen in the environment [8].
In a study, it was tried to determine the effects of synthetic and organic fertilizers on greenhouse gas emissions in soils with different soil structures [20]. For this purpose, greenhouse gas flows were measured for 8 weeks by applying urea ammonium nitrate (UAN) fertilizer and liquid pig manure in two different soils with sandy loam and clayey texture. It has been revealed that N2O and CH4 gas emissions in urea ammonium nitrate and pig manure applications are higher in sandy loam soil than in clay soil. It is thought that the amount of emission is less since, high cation exchange capacity and increased adsorption of NH4+, reduces the presence of nitrogen. In addition, it was stated that the higher water-filled pore volume in sandy loam soil may have supported denitrification and methane production compared to clay soil.
Emissions due to the application of nitrogen fertilizers can vary depending on the soil and the properties of the fertilizers used, as well as the composition and amount of soil microorganisms. In a study on this subject, it was desired to determine the possible effects of different nitrogen fertilizers on greenhouse gas emissions in different soil, plant and microorganism interactions [21]. In the study, three different fertilizer types were tested on two different soils with different properties in barley cultivation. Overall, the results showed that fertilization strongly increased plant respiration, resulting in higher CO2 emission levels and as a result of increased root secretion, higher microbial activities were detected. At the end of the study, it was emphasized that the evaluation of soil microorganism structure is of primary importance while examining the effect of nitrogen fertilization on soil-induced global warming potential. Particular emphasis was placed on the contribution of bacterial and archaeal ammonia oxidizers to N2O emissions. Since N2O emissions may increase as a result of nitrification, it has been pointed out that it is important to determine the optimum ratios of NH4+ ions to NO3- ions and to use nitrification inhibitors while fertilizing.
Effects of Fertilizers with Increased Efficiency on Emission Reduction
Increasing the effectiveness of fertilizers, both minimizing possible losses in the soil and enabling plants to benefit from the nutrients they contain at a higher rate has been a method that has been started to be preferred in recent years. These fertilizers, which are generally called as productivity-enhanced fertilizers, are defined by the Association of American Plant Food Control Officials (AAPFCO) as "fertilizer products with properties that increase plant uptake and reduce nutrient loss" [22]. Different methods such as coating, encapsulation and inhibitor addition are used in such products, which aim to increase the efficiency of nitrogen fertilizers. In this way, it is possible to spread the nitrogen release over a wide period and the losses are minimized.
Slow and controlled release fertilizers and inhibitor added fertilizers have higher nitrogen utilization efficiency and have the potential to reduce N2O emissions from fertilization. Some of the results presented by Halvorson et al., 2014 [23], who compiled their studies on this subject at different times, are given below. Studies are done in irrigated farming conditions and on corn plant cultivation:
A controlled release polymer-coated urea reduces N2O emissions by 42% compared to urea and 14% compared to urea ammonium nitrate fertilizer (UAN) in no-tillage and minimum tillage environments, there was no difference in emission values under conventional tillage conditions. The application of inhibitory urea fertilizer decreased the N2O emission value by 46% compared to normal urea and by 21% compared to urea ammonium nitrate.
In the application of inhibitory urea ammonium nitrate (UAN) fertilizer, the emission value decreased by 61% compared to normal urea and by 41% compared to urea ammonium nitrate fertilizer.
In a study using a slow-release UAN source, the decrease in N2O emissions was found to be 57% for urea and 28% for UAN.
In a study conducted in the central regions of China, the effects of nitrogen fertilizer sources on greenhouse gas emissions in rice fields were tried to be determined [24]. For this purpose, a control plot without fertilizer (N0), only inorganic fertilizer application (IF), only organic fertilizer application (OF), mixed application of inorganic fertilizer and slow release fertilizer (SRIF) and mixed application of inorganic and organic fertilizer (OFIF) topics are compared. According to the results obtained in the study, nitrogen fertilizer sources significantly affected CH4 and N2O emissions. Compared with the control (N0) implementation, the IF, SRIF, OF, and OFIF increased CH4 emissions by 55%, 42%, 51% and 66% and N2O emissions by 165%, 93%, 130% and 251% respectively. As a result of the study, the researchers suggested that the application of chemical fertilizers together with slow release fertilizer is a sustainable strategy to increase rice production and reduce greenhouse gas emissions, but the high fertilizer costs that arise should be subsidized by public institutions.
Greenhouse Gas Emissions During Fertilizer Production
Haber-Bosch's technique for the production of ammonia (NH3) using nitrogen (N) and hydrogen (H) is the primary method of nitrogen fertilizer production in the world and this method requires high temperature and high energy [25]. It is estimated that approximately 1.2% of the energy used in the world is consumed during fertilizer production also same rate (1.2%) of the total greenhouse gas emissions are produced [26]. During the production of ammonia, approximately 1250 m3 of natural gas is required for 1 metric ton of anhydrous ammonia [27]. Production of ammonia and urea, are among the major sources of CO2 emissions from human activities. Therefore, depending on their use, fertilizers not only emit greenhouse gases, but also release a significant amount during their production. The amount of greenhouse gases released into the atmosphere during fertilizer production globally in 2020 has been reported as 389142 Kilotons of CO2 equivalent [2].
Greenhouse gas emissions from fertilizer production varies greatly depending on the type of fertilizer used and the production technology. Considering the complex processes in the production phase, it is clear that the calculation of emission data will be difficult and limited. Life Cycle Assessment (LCA) is a widely used method to reveal emissions. This evaluation is an application that calculates the results of all activities carried out during the production phase that have a direct or indirect effect on living life and is defined as an ecological indicator. In this assessment, the environmental impacts of products and processes are thoroughly analyzed, ie emissions from production and application are included. Emission factors provide a convenience that does not require detailed emission calculations in the Life Cycle Assessment [28]. An emission factor is the typical amount of greenhouse gases released into the atmosphere per unit activity. Researchers conducted a study in which they compiled published emission factors related to nitrogen, phosphorus and some compound fertilizer production to be used as inputs in greenhouse gas balance calculations . Some of the results given in this study are tried to be summarized in Table 3. The main greenhouse gases that occur during the production of nitrogen fertilizer are CO2, which is formed as a result of the burning of natural gas used in the synthesis of ammonia and N2O, which is released during the production of nitric acid. CO2 emitted due to the use of fossil fuels during the production of phosphorus fertilizers and CO2 emitted during the transportation of raw materials have been the main greenhouse gases in production.
Table 3. GHG emission factors of some fertilizers (adapted from Wood & Cowie, 2004 [28])
| Product | Country | Contents | g CO2 equivalent | Source | ||||
|---|---|---|---|---|---|---|---|---|
| N:P:K | kg N | per kg P2O5 | per kg K2O | kg per product | CO2:N2O:CH4 | |||
| AN | European average | 35.0:0:0 | 7031 | - | - | 2461 | 39.6:59.5:0.9 | [29] |
| AN | Holland | 33.5:0:0 | 7109 | - | - | 2381 | 38.5:60.9:0.5 | [30] |
| AN | United Kingdom | 33.5:0:0 | 6537 | - | - | 2190 | 29.1:69.7:1.2 | [31] |
| CAN | Sweden : | 27.6:0:0 | 8467 | - | - | 2337 | 38.3:60.9:0.8 | [29] |
| CAN | European avg. | 26.5:0:0 | 7482 | - | - | 1983 | 39.8:60.6:0.9 | [29] |
| Urea | European avg. | 46:0:0 | 4019 | - | - | 1849 | 97.5:0.1:2.3 | [29] |
| Urea | Europe | 46:0:0 | 1707 | - | - | 785 | - | [32] |
| UAN | European avg. | 32:0:0 | 5763 | - | - | 1844 | 59.1:39.5:1.4 | [29] |
| UAN | European avg. | 32:0:0 | 4093 | - | - | 1310 | - | [26] |
| UAN | European modern technology | 32:0:0 | 2000 | - | - | 640 | - | [26] |
| TSP | European avg. | 0:48:0:0 | - | 1084 | - | 520 | 96.7:0.5:2.8 | [29] |
| TSP | European avg. | 0:48:0:0 | - | 354 | - | 170 | - | [26] |
| MAP | European avg. | 11:52:0 | 6393 | 1352 | - | 238 | 97.9:0.3:1.9 | [29] |
| MAP | European avg. | 11:52:0 | 2818 | 596 | - | 310 | - | [26] |
| DAP | European avg. | 18:46:0 | 4812 | 1883 | - | 866 | 97.8:0.2:1.9 | [29] |
| NPK | Sweden | 17:04:13 | 9416 | 40018 | 12313 | 1601 | 40.2:59.0:0.8 | [29] |
| NPK | Sweden | 20:05:04 | 9546 | 38183 | 47729 | 1909 | 37.9:61.4:0.8 | [29] |
| NPK (Acid) | European avg. | 15:15:15 | 7496 | 7496 | 7496 | 1124 | 52.1:46.9:1.0 | [29] |
| NPK (Nitro) | European avg. | 15:15:15 | 7896 | 7896 | 7896 | 1184 | 50.8:48.2:1.1 | [29] |
When Table 3 is examined, it can be seen that there are significant differences between different studies in terms of emission factors for each fertilizer product. It has been reported that these differences are due to plant differences, emission control mechanisms and differences in raw material inputs.
In a study examining greenhouse gas emissions arising from the production and use of inorganic and organic fertilizers, more than 200 articles were selected from among many original studies, and the results were shared [33]. In the study, emission factors were evaluated during fertilizer production. In the production of synthetic nitrogen fertilizers, depending on the type of fertilizer and the hydrogen source used during production, the emission factor has been reported to vary between 1 to 10 kg CO2 equivalents per 1 kg N while the emission factor reported for phosphorus fertilizer production varies between 1-1.5 kg CO2-eq.kg-1 P2O5. It is stated that there is insufficient information about emissions from potash fertilizer production. Researchers have generally emphasized that there are variations in emission factors due to differences in raw materials and application differences between countries.
The emissions generated during compost production varied in a wide range. The emission factor for one ton of solid waste has been reported as 1-2300 kg CO2 equivalent. Emissions from transport have generally been found to be very low for all fertilizer types
It has been reported that organic fertilizers have high emissions, especially during long-term storage. It has been stated that while the CH4 emissions decrease during the storage of liquid organic wastes or fertilizers, there is an increase in N2O emissions. Emissions from the storage of synthetic fertilizers or compost have been reported to be negligible, but it has also been stated that there is little data on the storage of compost.
Greenhouse Gas Emissions through Animal Manures
Animal manure has a significant share in greenhouse gas emissions originating from agriculture. The management of animal manure, manure left in the pastures and manure applied to the soil cause approximately 22% of the greenhouse gas emissions from agriculture [2]. Emissions from animal manure resulting from livestock activities are methane (CH4) and nitrous oxide (N2O) gases [34]. Greenhouse gases emissions by animal manure vary greatly according to many factors. The IPCC, established by the United Nations Environment Program in a decision-making capacity to assess the risks of climate change caused by human activities, offers methodologies to be used in estimating national inventories for greenhouse gas emissions. For this purpose, CH4 gas emission factors based on the IPCC's "National Greenhouse Gas Emission Inventory Report and based on the average annual temperature of 20°C for different animals are given in Table 4. In the table, Eastern European values are taken into account for cattle, pigs and buffaloes, while the values of developed countries are used for other animals.
Table 4. Methane emission factor in animal manure management (adapted from IPCC 2006 [35])
| farm animal | Emission Factor (kg CH4 per animal-1.year-1 ) |
|---|---|
| Dairy cattle | 27 |
| Other cattle | 13 |
| Pig | 5 |
| Breeding pig | 8 |
| Buffalo | 11 |
| Sheep | 0.28 |
| Goat | 0.20 |
| Camel | 2.37 |
| Horse | 2.34 |
| Donkey and mule | 1.10 |
| Chicken | 0.02 |
| Turkey | 0.09 |
| Duck | 0.03 |
With the increasing human population, the number of animals raised in a closed system in order to meet their food needs is also increasing. Fertilizers from animals are widely used in arable fields. These products, which are of great importance as improving soil health, also contribute directly or indirectly to greenhouse gas emissions. The potential greenhouse gas emission amounts of animal manures obtained from different countries are presented in Table 5.
Table 5. Emissions of carbon dioxide (CO2), methane (CH4) and nitrous oxide (N2O) from animal manure produced in some countries (adapted from Thangarajan et al., 2013 [36])
| Country | animal type | Amount and Rate of Potential Greenhouse Gas Emissions | |||||
|---|---|---|---|---|---|---|---|
| CO2–C (Gg year-1) | % of total emissions | CH4 CO2 –C eq. (Gg year-1) | % of total emissions | N2O CO2 –C eq. (Gg year-1 ) | % of total emissions | ||
| Australia | Chicken Cattle Pig Sheep |
357 8781 158 4509 |
0.09 2.10 0.04 1.08 |
56 1850 41 907 |
0.05 1.66 0.04 0.81 |
118 1947 53 1162 |
0.51 8.36 0.23 4.99 |
| USA | Chicken Cattle Pig Sheep |
9040 30837 4493 372 |
0.16 0.54 0.08 0.01 |
1417 6497 1151 75 |
0.21 0.97 0.17 0.01 |
2983 6837 1506 96 |
0.97 2.23 0.49 0.03 |
| New Zeland | Chicken Cattle Pig Sheep |
58 3240 23 2156 |
0.18 9.76 0.07 6.50 |
9 683 6 434 |
0.03 2.54 0.02 1.62 |
19 718 8 556 |
0.18 6.87 0.07 5.32 |
| Chinese | Chicken Cattle Pig Sheep |
20674 27525 32960 8875 |
0.67 0.90 1.07 0.29 |
3242 5800 8444 1786 |
0.45 0.81 1.17 0.25 |
6822 6103 11047 2288 |
2.58 2.31 4.18 0.87 |
| Bangladesh | Chicken Cattle Sheep |
982 7572 121 |
5.96 46.00 0.73 |
154 1595 24 |
0.02 6.38 24 |
324 1679 31 |
7.26 37.65 0.70 |
| South Africa | Chicken Cattle Pig Sheep |
689 4510 110 1623 |
0.22 1.43 0.03 0.51 |
108 950 28 327 |
0.25 2.20 0.07 0.76 |
227 1000 37 418 |
1.10 4.84 0.18 2.02 |
| Germany | Chicken Cattle Pig Sheep |
491 4208 1835 138 |
0.05 0.51 0.22 0.02 |
77 887 470 28 |
0.16 1.86 0.99 0.06 |
162 933 615 36 |
0.29 1.70 1.12 0.06 |
References
FAO, (2020). Emissions due to agriculture. Global, regional and country trends 2000–2018. FAOSTAT Analytical Brief Series No. 18. Rome
FAOSTAT, (2023). https://www.fao.org/faostat/en/#data/GT
IPCC, 2007: Climate Change 2007: The Physical Science Basis. Contribution of Working Group I to the Fourth AssessmentReport of the Intergovernmental Panel on Climate Change [Solomon, S., D. Qin, M. Manning, Z. Chen, M. Marquis, KB Averyt , M. Tignor and HL Miller (eds. )]. Cambridge University Press, Cambridge, United Kingdom and New York, NY, USA, 996 pp.
FAO, (2011) “Climate Change Mitigation Finance for Smallholder Agriculture”. A guide book to harvesting soil carbon sequestration benefits.
Ritchie, H., Roser M., & Rosado, P., (2020). "CO₂ and Greenhouse Gas Emissions". Published online at OurWorldInData.org. Retrieved from: 'https://ourworldindata.org/co2-and-greenhouse-gas-emissions
IPCC, (2013). Climate Change 2013: The Physical Science Basis. Contribution of Working Group I to the Fifth Assessment Report of the Intergovernmental Panel on Climate Change. [Stocker, TF, D. Qin, G.-K. Plattner , M. Tignor , SK Allen, J. Boschung , A. Nauels , Y. Xia, V. Bex and PM Midgley (eds.)]. Cambridge University Press, Cambridge, United Kingdom and New York, NY, USA, 1585 pp.
Environmental Protection Agency (EPA), (2022). Ecosystem Effects of Ozone Pollution. https://www.epa.gov/ground-level-ozone-pollution/ecosystem-effects-ozone-pollution (accessed 12.03.2023.)
Kayıkçıoğlu , HH, & Okur , N., (2012). greenhouse gas in the release agriculture role . Adnan Menderes University . zir . fac . Magazine , 9(2): 25-38
Tilstra , A., El-Khaled, YC, Roth, F. et al. (2019). Denitrification Aligns with N2 Fixation in Red Sea Corals. Sci Rep. 9, 19460 (2019). https://doi.org/10.1038/s41598-019-55408-z
Gregorich , E., Janzen, HH, Helgason , B., & Ellert , B. (2015). Nitrogenous Gas Emissions from Soils and Greenhouse Gas Effects. Advances in Agronomy, 39–74. doi:10.1016/bs.agron.2015.02.004
Betzelberger , AM, Yendrek , CR, Sun, J., Leisner , CP, Nelson, RL, Avg, DR, & Ainsworth, EA, (2012). Ozone exposure response for US soybean cultivars: linear reductions in photosynthetic potential, biomass, and yield. Plant Physiol. 160, 1827e1839
Snyder, CS, Bruulsema , TW, Jensen, TL, & Fixen . PE (2009). Review of greenhouse gas emissions from crop production systems and fertilizer management effects. Agriculture, Ecosystems and Environment, 133: 247–266
Erisman , JW, Sutton, MA, Galloway, J., Klimont , Z., & Winiwarter , W. (2008). How a century of ammonia synthesis changed the world. Nature Geoscience, 1(10), 636–639. doi:10.1038/ngeo325
Stehfest , E., & Bouwman , L., (2006). N 2 O and NO emissions from agricultural fields and soils under natural vegetation: summarizing available measurement data and modeling of global annual emissions. Nutr . Cycling Agroecosyst . 74, 207e228
Linquist , B., van Groenigen , KJ, Adviento-Borbe , MA, Pittelkow , C., & van Kessel, C., (2012). An agronomic assessment of greenhouse gas emissions from major cereal crops. Global Change Biol. 18, 194e209
Gellings , CW, & Parmenter , KE (2016). Energy efficiency in fertilizer production and use. Efficient Use and Conservation of Energy; Gellings , CW, Ed.; Encyclopedia of Life Support Systems, 123-136
FAO, (2014). Agriculture, Forestry and Other Land Use Emissions by Sources and Removals by Sinks. FAO Statistics Division Working Paper Series ESS/14-02
Zhang, W. -f., Dou, Z. -x., He, P., Ju , X.-T., Powlson , D., Chadwick, D., … Zhang, F.-S. (2013). New technologies reduce greenhouse gas emissions from nitrogenous fertilizer in China. Proceedings of the National Academy of Sciences, 110(21), 8375–8380. doi:10.1073/pnas.1210447110
Chai, R., Ye, X., Ma, C., Wang, Q., Tu , R., Zhang, L., & Gao, H. (2019). Greenhouse gas emissions from synthetic nitrogen manufacture and fertilization for main upland crops in China. Carbon Balance and Management, 14(1). doi:10.1186/s13021-019-0133-9
Jarecki , MK, Parkin , TB, Chan, ASK, Hatfield, JL, & Jones, R. (2008). Greenhouse Gas Emissions from Two Soils Receiving Nitrogen Fertilizer and Swine Manure Slurry. Journal of Environmental Quality, 37(4), 1432–1438. doi:10.2134/jeq2007.0427
Inselsbacher , E., Wanek , W., Ripka , K., Hackl, E., Sessitsch , A., Strauss, J., & Zechmeister-Boltenstern , S. (2010). Greenhouse gas fluxes respond to different N fertilizer types due to altered plant-soil-microbe interactions. Plant and Soil, 343(1-2), 17–35. doi:10.1007/s11104-010-0597-6
Association of American Plant Food Control Officials, (2013). AAPFCO Official Publication 65. AAPFCO, Little Rock, AR.
Halvorson, AD, Snyder, CS, Blaylock, AD, & Del Grosso, SJ (2014). Enhanced-Efficiency Nitrogen Fertilizers: Potential Role in Nitrous Oxide Emission Mitigation. Agronomy Journal, 106(2), 715. doi:10.2134/agronj2013.0081
Zhang, ZS, Chen, J., Liu, TQ, Cao, CG, & Li, CF (2016). Effects of nitrogen fertilizer sources and tillage practices on greenhouse gas emissions in paddy fields of central China. Atmospheric Environment, 144, 274–281. doi:10.1016/j.atmosenv.2016.09.0
Modak , J.M. (2002). News process for ammonia synthesis. Resonance, 7(9), 69-77.
Kongshaug , G. 1998. Energy Consumption and Greenhouse Gas Emissions in Fertilizer Production. IFA Technical Conference, Marrakech, Morocco, 28 September-1 October, 1998, 18pp.
Gellings , CW, & Parmenter , KE (2016). Energy efficiency in fertilizer production and use. Efficient Use and Conservation of Energy; Gellings , CW, Ed.; Encyclopedia of Life Support Systems, 123-136.
Wood, SW, & Cowie, A. (2004). A review of greenhouse gas emission factors for fertiliser production.http://www.sciencetheearth.com/uploads/2/4/6/5/24658156/2004_wood_a_review_of_greenhouse_gas_emission_factors.pdf
Davis, J. & Haglund , C. (1999). Life Cycle Inventory (LCI) of Fertiliser Production. Fertiliser Products Used in Sweden and Western Europe. SIK-Report No. 654. Master’s Thesis, Chalmers University of Technology
Kramer, KJ, Moll, HC & Nonhebel , S. (1999). Total Greenhouse Gas Emissions Related to the Dutch Crop Production System. Agriculture, Ecosystems and Environment, 72, 9-16
Elsayed , MA, Matthews, R. & Mortimer, ND (2003). Carbon and Energy Balances for a Range of Biofuels Options. Report by Resources Research Unit, Sheffield Hallam University for DTI Sustainable Energy Programs
Kuesters , J. & Jenssen , T. (1998). Selecting the Right Fertilizer from an Environmental Life Cycle Perspective. IFA Technical Conference, Marrakech, Morocco, 28 September-1 October, 1998, 7pp.
Walling, E., & Vaneeckhaute , C. (2020). Greenhouse gas emissions from inorganic and organic fertilizer production and use: A review of emission factors and their variability. Journal of Environmental Management, 276, 111211. doi:10.1016/j.jenvman.2020.11121
Black, G., Alone, I. & Sayar, M. (2019). Konya Province Animal Husbandry Fertilizer Welded Greenhouse Gas Emissions Status. National Environment Science Research Journal, 2 (2), 57-60. Retrieved from https://dergipark.org.tr/tr/pub/ucbad/issue/47445/599015
IPCC, 2006. Intergovernmental Panel on Climate Change Guidelines for National Greenhouse Gas Inventories. http://www.ipcc-nggip.iges.or.jp/public/2006gl/ .
Thangarajan , R., Bolan, NS, Tian, G., Naidu, R., & Kunhikrishnan , A. (2013). Role of organic amendment application on greenhouse gas emission from soil. Science of The Total Environment, 465, 72–96. doi:10.1016/j.scitotenv.2013.01.031