
Module 5 · Chapter 3
Direct effects of livestock production on GHG emissions
According to estimates, livestock production is a significant source of greenhouse gas emissions, contributing 14.5% in total anthropogenic emissions, i.e. 8.1 gigatons of CO2 equivalent per year [1]. CO2 equivalent (CO2-eq) is a unit of measurement for carbon dioxide, usually expressed in metric tons, and is used to standardise the measurement of all greenhouse gases (GHGs) that contribute to global warming. These gasses retain heat in the Earth's atmosphere, leading to rising temperatures and other climate changes.
The carbon footprint is used as a measure of the amount of CO2 and other GHG emissions released into the atmosphere during human activities (energy use, transportation, food production, etc.). It provides a way to quantify the total amount of GHG emissions produced by a particular activity, product, or person. To calculate the carbon footprint, all GHG emissions are converted into CO2-eq based on their global warming potential (GWP). GWP indicates how much heat a gas traps in the atmosphere compared to CO2 over a given period of time (usually 100 years). Thus, depending on the source, methane has a GWP value 28-36 times that of CO2 over 100 years, so that the emission of 1 tonne of methane is equivalent to the emission of 28-36 tonnes of CO2 equivalent. The GWP value of nitrous oxide is 265 times that of CO2 over 100 years, so the emission of 1 tonne of nitrous oxide is equivalent to the emission of 265 tonnes of CO2-eq. By using the CO2-eq measure, it is possible to compare emissions of different greenhouse gases and monitor progress in reducing total greenhouse gas emissions over time.
Methane (CH4), nitrous oxide (N2O) and carbon dioxide (CO2) are the three primary greenhouse gasses released by livestock. Carbon dioxide is released primarily from the combustion of fossil fuels in power machinery and from the burning of biomass through microbial decomposition. Carbon dioxide emissions can also result from the conversion of arable land into permanent grassland (through land use change) or from adjustments in agricultural land management. Methane is produced during the decomposition of organic material under anaerobic conditions (during enteric fermentation of ruminants, storage of manure, or organic waste from the processing industry). Nitrogen oxides are released during the microbial transformation of nitrogen in the soil or in manure.
The FAO Global Environmental Assessment Model in Livestock (GLEAM) [2] was used to analyze the relative abundance of the mentioned gasses, and the IPCC (2014) 100-year warming potential (298 for N2O and 34 for CH4) was used to convert their levels into CO2-eq.
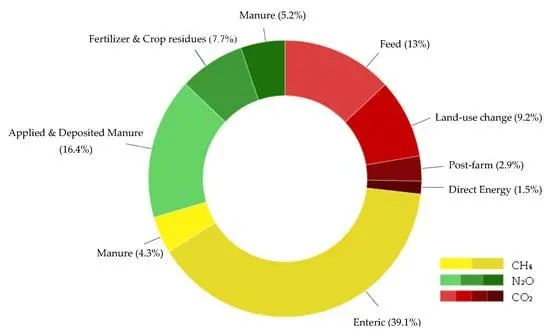
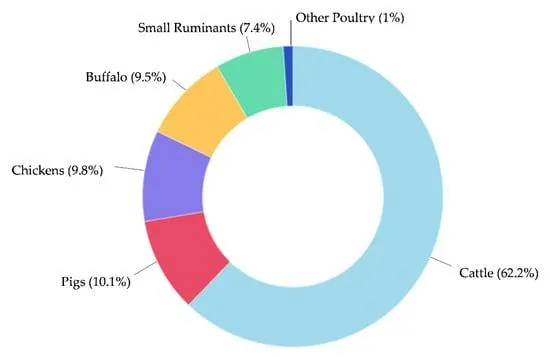
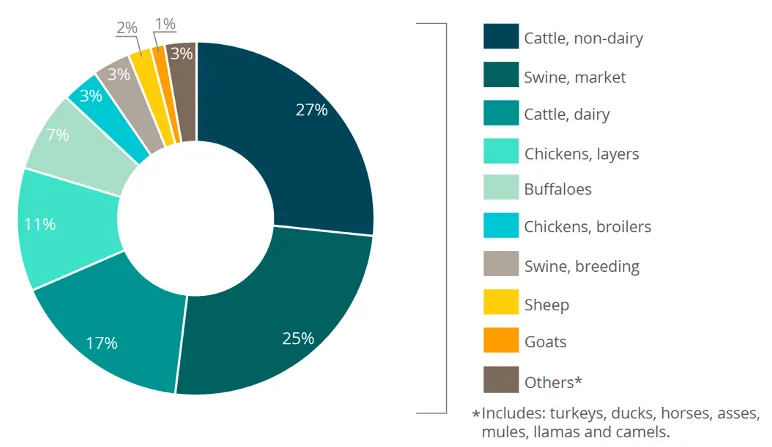
According to this model, methane (CH4), nitrous oxide (N2O) and carbon dioxide (CO2) account for 50%, 24% and 26% of emissions respectively in the animal products supply chain (Figure 1). With a participation of about 62% of the total emission of all types of livestock, cattle are the main source of GHG. At the same time, dairy and beef cattle produce similar amounts of emissions. Emissions from other species (including pigs, poultry, buffalo and small ruminants) range from 7 to 11% individually. Figure 2 shows the estimated share of emissions by livestock species.
The values of CO2 equivalent emissions in cattle production estimated using the GLEAM model [2] are 3.0 for beef and 1.6 gigatons for milk. Pork production emits 0.82 gigatons of CO2 -eq, chicken meat and eggs 0.79 gigatons of CO2-eq, buffalo meat and milk 0.7 gigatons of CO2-eq and 0.5 gigatons of CO2-eq from small ruminant meat and milk production. Other poultry and non-edible products account for the rest of the emissions.
Comparing emissions between different types of animal products based on protein production is perhaps a more relevant way to express these relationships. In this case, buffalo meat is characterized by the highest emissions intensity, averaging 404 kg of CO2-eq per kg of protein produced. In second place is beef production with an average of 295 kg CO2 -eq per kg protein. This is followed by meat and milk from small ruminants and buffalo milk, with emissions of 201, 148 and 140 kg CO2 -eq per kg protein, respectively. In this calculation, the group with the lowest emission intensity (less than 100 kg CO2 -eq per kg protein) includes the production of cow milk, poultry meat and eggs, and pork [2]. It is important to emphasize that the estimated emission intensity varies significantly depending on the region, i.e. agroecological conditions, applied production technology and overall management.
Direct emissions are those resulting from animal husbandry, including the release of harmful gasses through enteric fermentation and manure. The group of direct emissions can also include emissions that occur through accompanying energy consumption. Indirect emissions mainly come from animal feed production and related land use changes. The ratio of the sizes of direct and indirect emissions has not yet been fully clarified, i.e. It is still not possible to specify which of these two types of emissions has the greater share [3; 4].
Enteric Fermentation
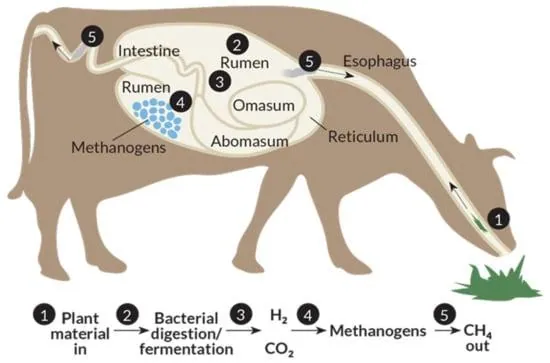
In the digestive system of ruminants (figure 3), the process of enteric fermentation takes place, which involves the decomposition of organic matter, mainly of fibrous-cellulosic type, under the influence of the microflora present [5]. This is essentially a unique and useful process that enables the conversion of hard-to-degrade substances (cellulose, lignin) into nutritionally valuable substances that are ultimately used for human nutrition. However, during enteric fermentation, there is also the formation of harmful gas-methane, which animals release into the environment (by exhaling, belching, defecating). In this way, ruminants are the group of domestic animals that contribute the most to the emission of methane into the atmosphere [6].
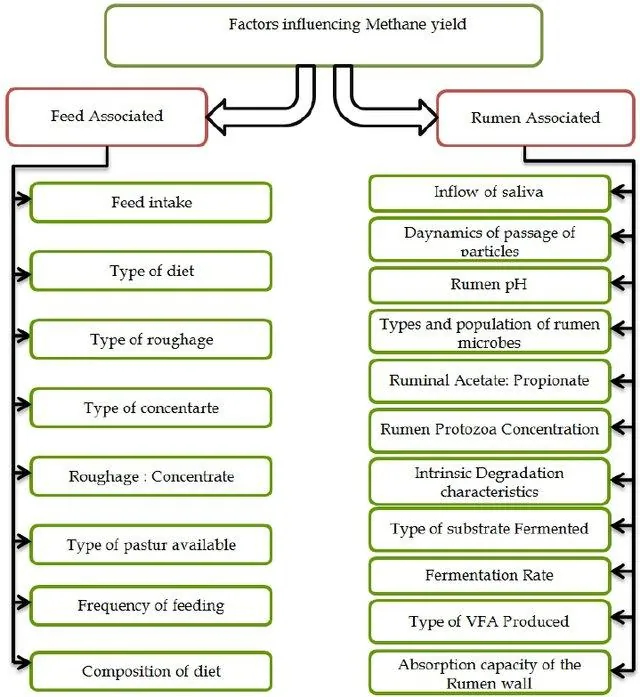
Methane produced by enteric fermentation accounts for 39.1% of total GHG emissions (Figure 1), and has a 28 times higher atmospheric warming potential than CO2 [7]. In non-ruminants, methane production also takes place, but in incomparably smaller amounts. However, the amount of methane produced by ruminants is not constant, but is influenced by various factors (Figure 4).
The feed intake has the greatest influence on the emission, i.e. The amount of nutrients consumed as well as their quality. Thus, with the increase in feed digestibility, methane synthesis decreases and animal productivity increases. If animals consume more abundant meals, this is reflected in increased methane emissions. In addition, the health status of animals and the presence of feed additives can also have an impact on emissions.
It can be concluded that the ruminant species, the production system as well as the regional characteristics synergistically influence the speed at which food energy will be converted into methane [1].
Given the contribution of ruminants to CH4 emissions and the negative impact of methanogenesis on productivity, it is necessary to find effective ways to reduce this process. So far, several strategies have been defined, generally related to dietary and management modulations, manipulations of rumen activity, and advanced strategies at the molecular and biochemical levels. This will be discussed in detail in a subsequent chapter.
Manure Management
The ongoing intensification and specialization of livestock production is leading to an increase in the amount of manure which is a source of the greenhouse gases (GHGs) methane (CH4) and nitrous oxide (N2O). It is estimated that manure is responsible for nearly 10% of total greenhouse gas emissions [2]. Net emissions of these gases result from a variety of microbial activities in the manure [9]. Cattle and pigs represent the largest source of methane emissions from manure as it is showed in figure 5 [4;10]. In contrast to enteric fermentation, which mainly releases methane, manure is also a substrate for the release of nitrogen oxides in addition to methane.
Figure 1 shows that the average contribution of methane and nitrogen oxide emissions from manure to total GHG emissions is 4.3% and 5.2%, respectively. The absolute and relative values of emissions of these gases from manure depend on environmental conditions (air temperature, humidity), the duration of storage and handling of the manure, and the type of animal feed. For example, the formation of methane is favorably influenced by anaerobic conditions, while both aerobic and anaerobic conditions are required for the formation of nitrogen oxides from ammonia [4].
It has been found that the greatest amounts of nitrogen oxides are released when manure is deposited in a solid state or spread on the ground [3]. This corresponds to an estimated 16.4% share of nitrogen oxide emissions for deposited/applied manure, as shown in Figure 1. Conversely, when manure is stored in a liquid state (lagoons), gas emissions increase in favor of methane [10].
Energy Consumption
Many production processes in animal husbandry require the use of energy, such as the production of fertilizers, the use of machinery, and the transportation of feed and livestock. On farms themselves, energy is required for heating/cooling, feeding, ventilation, lighting, milking, and manure management. Electricity is generally used for lighting, feeding, and milking systems, while fossil fuels associated with direct energy consumption are used for manure management and heating. The production of feed for livestock, as well as the production of animal products, also involves energy consumption. It can be concluded that energy consumption in animal husbandry is concentrated in the production of feed, housing, and manure management.
The source of energy in animal husbandry is mainly fossil fuels, and its consumption represents another source of C02 emissions. It is estimated that the total energy consumption in the production cycle of animal products contributes about 25% of the total emissions in the livestock sector [1].
Throughout the production process, it is assumed that the production of animal feed (concentrates, canned feed, or pasture) represents the largest energy consumption [11]. Problematically, there are some analytical inconsistencies here, as energy consumption associated with feed production occurs off-farm and is generally not attributed to the livestock sector in official agricultural statistics.
Feed production, storage, and transportation are intensive processes that consume large amounts of energy associated with fuel, fertilizers, and pesticides. In addition, the production of animal products is generally energy inefficient, since a large part of the energy of the meal is spent on the maintenance of body structure (tissue regeneration) and physiological processes (heat losses), and less on the production of structures used in human nutrition [12]. Of all the parameters that influence energy consumption in livestock production, the most important are the species and type of animals, geographical location, agroecological conditions, and production system.
In relation to the breed and type (purpose) of livestock, Paris et al [13] found that energy consumption ranges from 2.1 to 5.3 MJ/kg per ECM in cow milk production, 59.2 MJ/kg for cow-calf system production, 15.9 MJ/kg to 22.7 MJ/kg in pork production, 9.6 MJ/kg to 19.1 MJ/kg in broiler production, 20.5 to 23.5 MJ/kg in egg production (Figure 6).
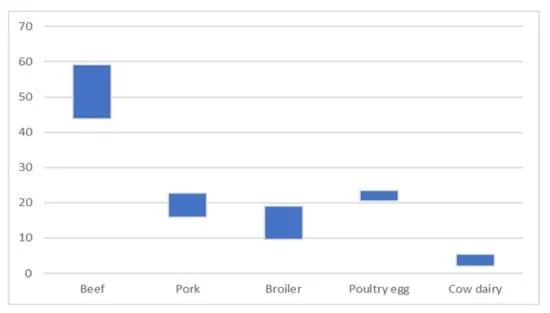
In a meta-study by Paris et al [13], feed production dominated as an indirect energy input (75% of consumption) in all livestock systems (EU-27) except beef production (Table 1). Housing and feeding (mainly in the form of electricity) and manure management (mainly using diesel) account for the majority of direct energy consumption in beef production. In dairy farming, milking, milk cooling, and water heating accounted for most of the direct energy use. Here, there are differences in energy sources depending on the geographic location of the study, as some locations primarily use electricity for a particular purpose, while others use fossil fuels directly. Electricity use for water pumping, lighting, and other activities proved to be relatively low. According to the included studies, cattle farming was the most energy-intensive production system (per kilogram of meat), followed by pig and poultry farming.
Table 1. Intervals of energy inputs (low-high) for indirect (feeds) and direct consumption in different production systems (MJ/kg) [13].
| Production System | Animal Feed | Direct Energy Use | ||
|---|---|---|---|---|
| Low | High | Low | High | |
| Cow milk | 1.11 | 4.4 | 0.54 | 1.76 |
| Beef | 17.34 | 27.23 | 9.36 | 31.97 |
| Pork | 11.6 | 16.41 | 2.6 | 11.1 |
| Broiler | 6.5 | 14.82 | 0.5 | 6.6 |
| Egg | 10.3 | 13.2 | 0.6 | 10.3 |
In the coming years, the increasing intensification of agriculture will require a conversion of production methods in the livestock sector in order to contribute to environmental sustainability, i.e., to reduce the emission of harmful gasses. This would mean the conversion of livestock production to alternative and more sustainable production technologies based on ecological principles and greater use of renewable energy sources.
References
Gerber, P. J., Steinfeld, H., Henderson, B., Mottet, A., Opio, C., Dijkman, J., Falcucci, A., & Tempio, G. (2013). Tackling climate change through livestock: A global assessment of emissions and mitigation opportunities. Tackling Climate Change through Livestock: A Global Assessment of Emissions and Mitigation Opportunities. https://www.cabdirect.org/cabdirect/abstract/20133417883
Dashboard-old | Global Livestock Environmental Assessment Model (GLEAM) | Food and Agriculture Organization of the United Nations. (n.d.). Retrieved 24 March 2023, from https://www.fao.org/gleam/results/en/
Steinfeld, H., Gerber, P., Wassenaar, T. D., Castel, V., Rosales M., M., & Haan, C. de. (2006). Livestock’s long shadow: Environmental issues and options. Food and Agriculture Organization of the United Nations.
Grossi, G., Goglio, P., Vitali, A., & Williams, A. G. (2019). Livestock and climate change: Impact of livestock on climate and mitigation strategies. Animal Frontiers, 9(1), 69–76. https://doi.org/10.1093/af/vfy034
Zhao, Y., Nan, X., Yang, L., Zheng, S., Jiang, L., & Xiong, B. (2020). A Review of Enteric Methane Emission Measurement Techniques in Ruminants. Animals, 10(6), Article 6. https://doi.org/10.3390/ani10061004
Beauchemin, K. A., McAllister, T. A., & McGinn, S. M. (2009). Dietary mitigation of enteric methane from cattle. CABI Reviews, 2009, 1–18. https://doi.org/10.1079/PAVSNNR20094035
AR5 Synthesis Report: Climate Change 2014 — IPCC. (n.d.). Retrieved 23 March 2023, from https://www.ipcc.ch/report/ar5/syr/
Liu, G. (2012). Greenhouse Gases: Capturing, Utilization and Reduction. BoD – Books on Demand.
Petersen, S. O., Blanchard, M., Chadwick, D., del Prado, A., Edouard, N., Mosquera, J., & Sommer, S. G. (2013). Manure management for greenhouse gas mitigation. Animal, 7, 266–282. https://doi.org/10.1017/S1751731113000736
Johnson, D. E., & Ward, G. M. (1996). Estimates of animal methane emissions. Environmental monitoring and assessment, 42(1-2), 133–141. https://doi.org/10.1007/BF00394046
Beckman, J., Borchers, A., & Jones, C. A. (2013). Agriculture’s Supply and Demand for Energy and Energy Products (SSRN Scholarly Paper No. 2267323). https://doi.org/10.2139/ssrn.2267323
de Visser, C. L. M., de Buisonje, F. E., Ellen, H. H., Stanghellini, C., & van der Voort, M. P. J. (2012). State of the Art on Energy Efficiency in Agriculture, Country data on energy consumption in different agroproduction sectors in the European countries.
Paris, B., Vandorou, F., Tyris, D., Balafoutis, A. T., Vaiopoulos, K., Kyriakarakos, G., Manolakos, D., & Papadakis, G. (2022). Energy Use in the EU Livestock Sector: A Review Recommending Energy Efficiency Measures and Renewable Energy Sources Adoption. Applied Sciences, 12(4), Article 4. https://doi.org/10.3390/app12042142